Trading BTC/USD with NodeJS & Elasticsearch
Published:
by
mail@ankitgyawali.com
![]()
- Categories:
- cryptocurrency 1
This will be a 2 section blog where I will share my findings & strategies while implementing a crypto currency trading bot written in NodeJS.
Section 1 will focus more on setting up and use case aspect while Section 2 will describe the code/analysis portion.
Link to project code on github
Kibana dashboard Screenshots (Imgur mirror)
Direct Link to Kibana Dashboards (Username: guest, Password: 012GUE789st!)
(At the time of writing this blog all the dashboards should be publicly viewable - however since I am using a trial license of x-pack for authentication it will fail at some point unless I reset it. Thus the screenshots.)
Background
Feel free to skip the anecdote to jump right away into introduction
I got introduced to cryptocurrencies via Ethereum almost a year ago now. I vividly remembering running into this homepage before being side tracked into the rabbit hole of the crypto world. Crypto related sites and ads were starting to pop everywhere because of ethereum ICOs then. As someone who was just a little bit familiar with bitcoin and its motivation for decentralization from its 2013 bubble, the concept of smart contracts was quite intriguing.
After trading sporadically (with some quite painful lessons) for almost 6 months, I decided to look into writing a dedicated trading bot. The initial prototype had foundations using MySQL database via AWS RDS with python as back end code for analysis. I never ended up finishing the initial setup however and decided to use a completely different set of technologies (elasticsearch + nodejs) with a more event driven approach which I will be discussing on this article. Basic understanding of node js, elasticsearch and stock trading is recommended but not necessarily required for initial setup.
Introduction:
We will go through the bot setup by chunking out portions of the entire bot setup into various parts.
By the end of this article, I would like to have had shared my findings with the readers in following sub parts:
Section 1: Setup
- 1A. Technologies Used for Implementing the Trading bot
- 1B. Architechture setup of Trading Bot
- 1C. Visualizing Bitcoin Prices via Kibana to use for our trading
In Section 2 we will use the DSL queries from part 1C programmatically to take positions and generate signals.
Section 2: Technicals
- 2A. Brief Overview of Code Implementation
- 2B. Configuring and using this bot for taking positions with appropriate analysis
- 2C. Brief Overview of our bot's current/default performance
- 2D. Expansion ideas and some caveats of the Project
Section 1
1A. Technologies Used for Implementing the Trading Bot
The end to end bot will use 4 main technologies.
- NodeJS (Back-end ETL, Data Analysis & Position Taking) - We use node js to ingest bitfinex ticker data and pull out higher order data from elasticsearch to create positions using two separate crons.
- Elasticsearch (Data Persistance & Data Aggregation) - The project uses elasticsearch to store bitcoin price, volume and trade data. This is as opposed to MySQL or nosql json dumps like mongodb because elasticsearch is great for aggregate data processing - especially if you are trying to expose out hidden behaviours of data based on timeframes.
- Kibana (Visualization & DSL Modeling) - Use of Kibana allowes us to get real time insights into bitcoin prices via graphs and other visuals. We will be able to use Kibana as a personal real time charting view where we will create visuals to model and control our DSL calls to elasticsearch. There are 4 main kibana dashboards that is most frequently used for this project.
- Amazon EC2 Instances (Infrastructure) - We will use amazon's ec2 server to deploy our elasticsearch cluster. Elasticsearch can be installed locally for development purposes but it's convenient to have a dedicated server running online 24/7.
1B. Setting up of Trading Bot
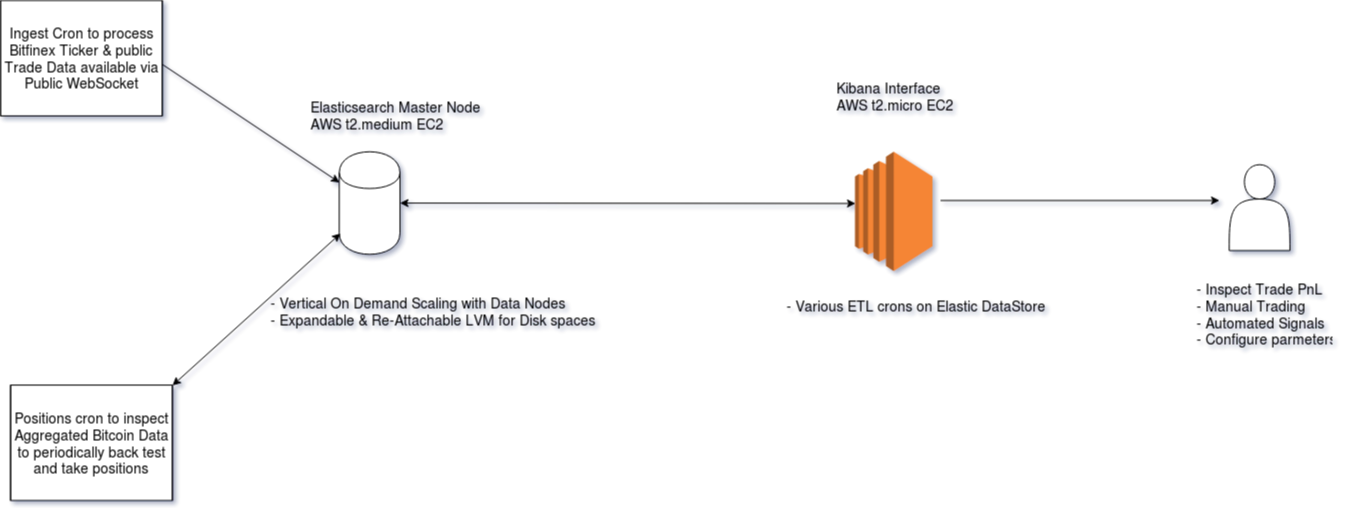
Architecturally, trading bot simply relies on two node crons (managed by pm2 - represented by two rectangles to the left) and an elasticsearch setup which can optionally be hooked up with kibana for visualization.
Dev Setup
- The node version required for this project is at least v8.9.4+ LTS. (nvm- short for node version manager is great if you need to run multiple node versions)
- Project repo can be cloned from here and dependencies installed with
npm install- You will need
pm2for managing bot processes (npm install -g pm2) - One of the node dependencies
tulindindicator needs to compile C binaries - ifnpm installfails for that module you can build directly withnpm install tulind --build-from-source. This will require you to ensure you haveg++installed on your system.
- You will need
- Ensure you have elasticsearch and kibana running on your localhost. Alternatively you can install it on an aws ec2 (recommended for serious users). Official elastic installation guide can be found here.
- Configure elasticsearch port on
config.json. Default elasticsearch port is already configured on the project repo. Run the following commands to run ingest cron and position taking crons respectively. We will discuss what each does in next section.npm run ingestnpm run takeposition
1C. Visualizing Price Indicators via Kibana to use for our trading
Dashboard Login: Username: guest, Password: 012GUE789st!
A variety of indicator visualizations are grouped by dashboards in kibana. The four most frequented dashboards are linked and described below:
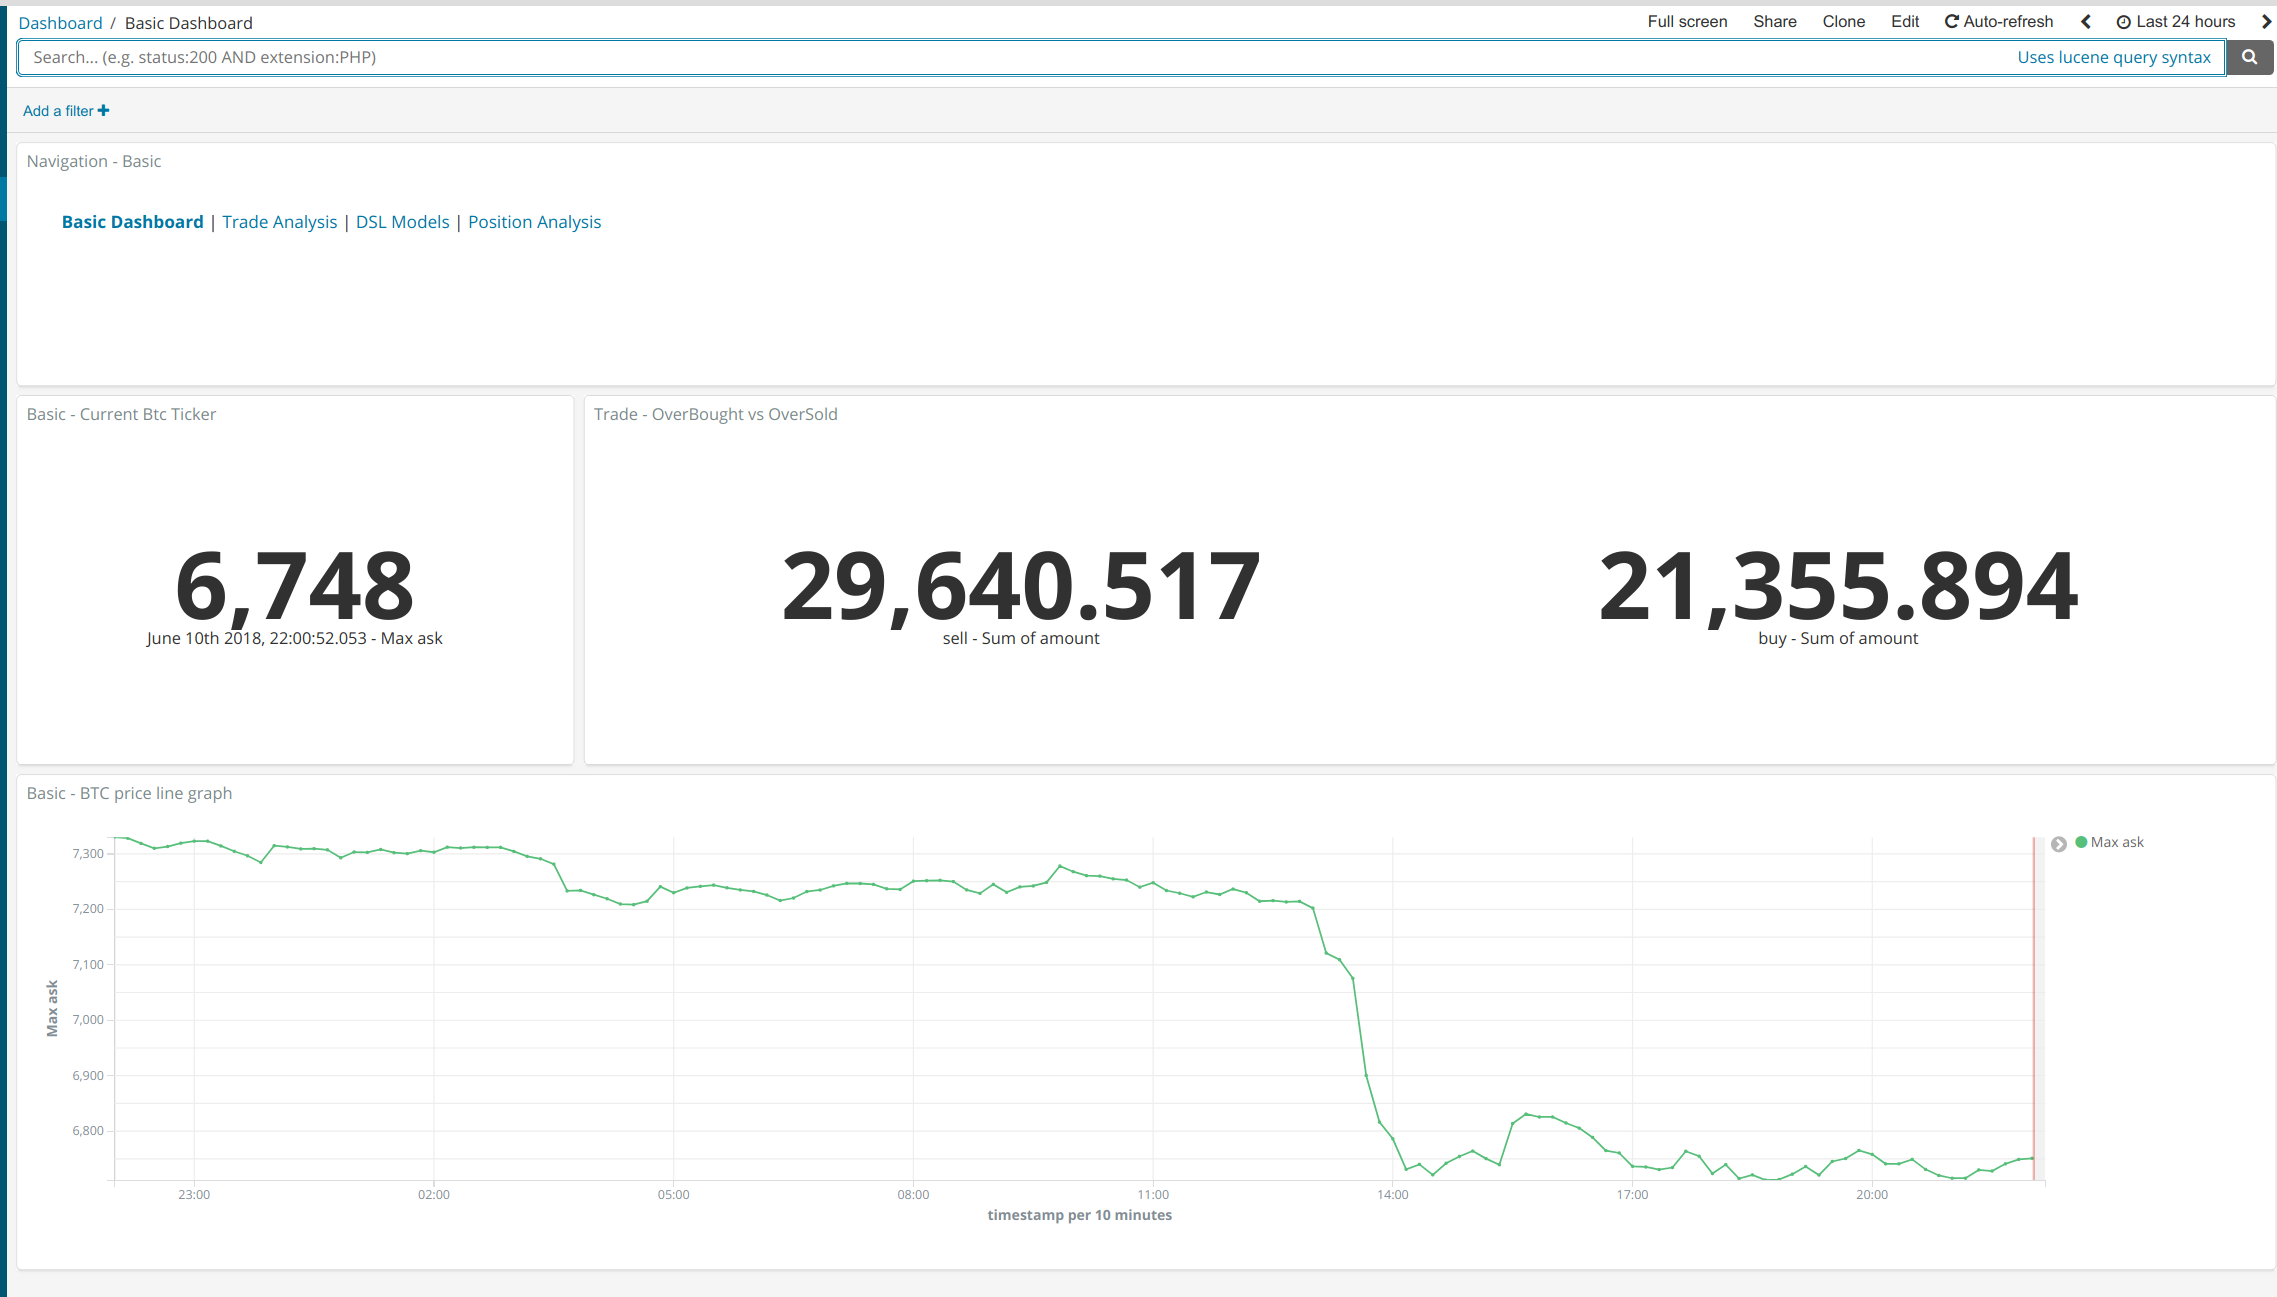
- Basic Dashboard - The default home dashboard that can be used for very basic inspection. It provides a brief overview of current Bitcoin prices and volume activity.
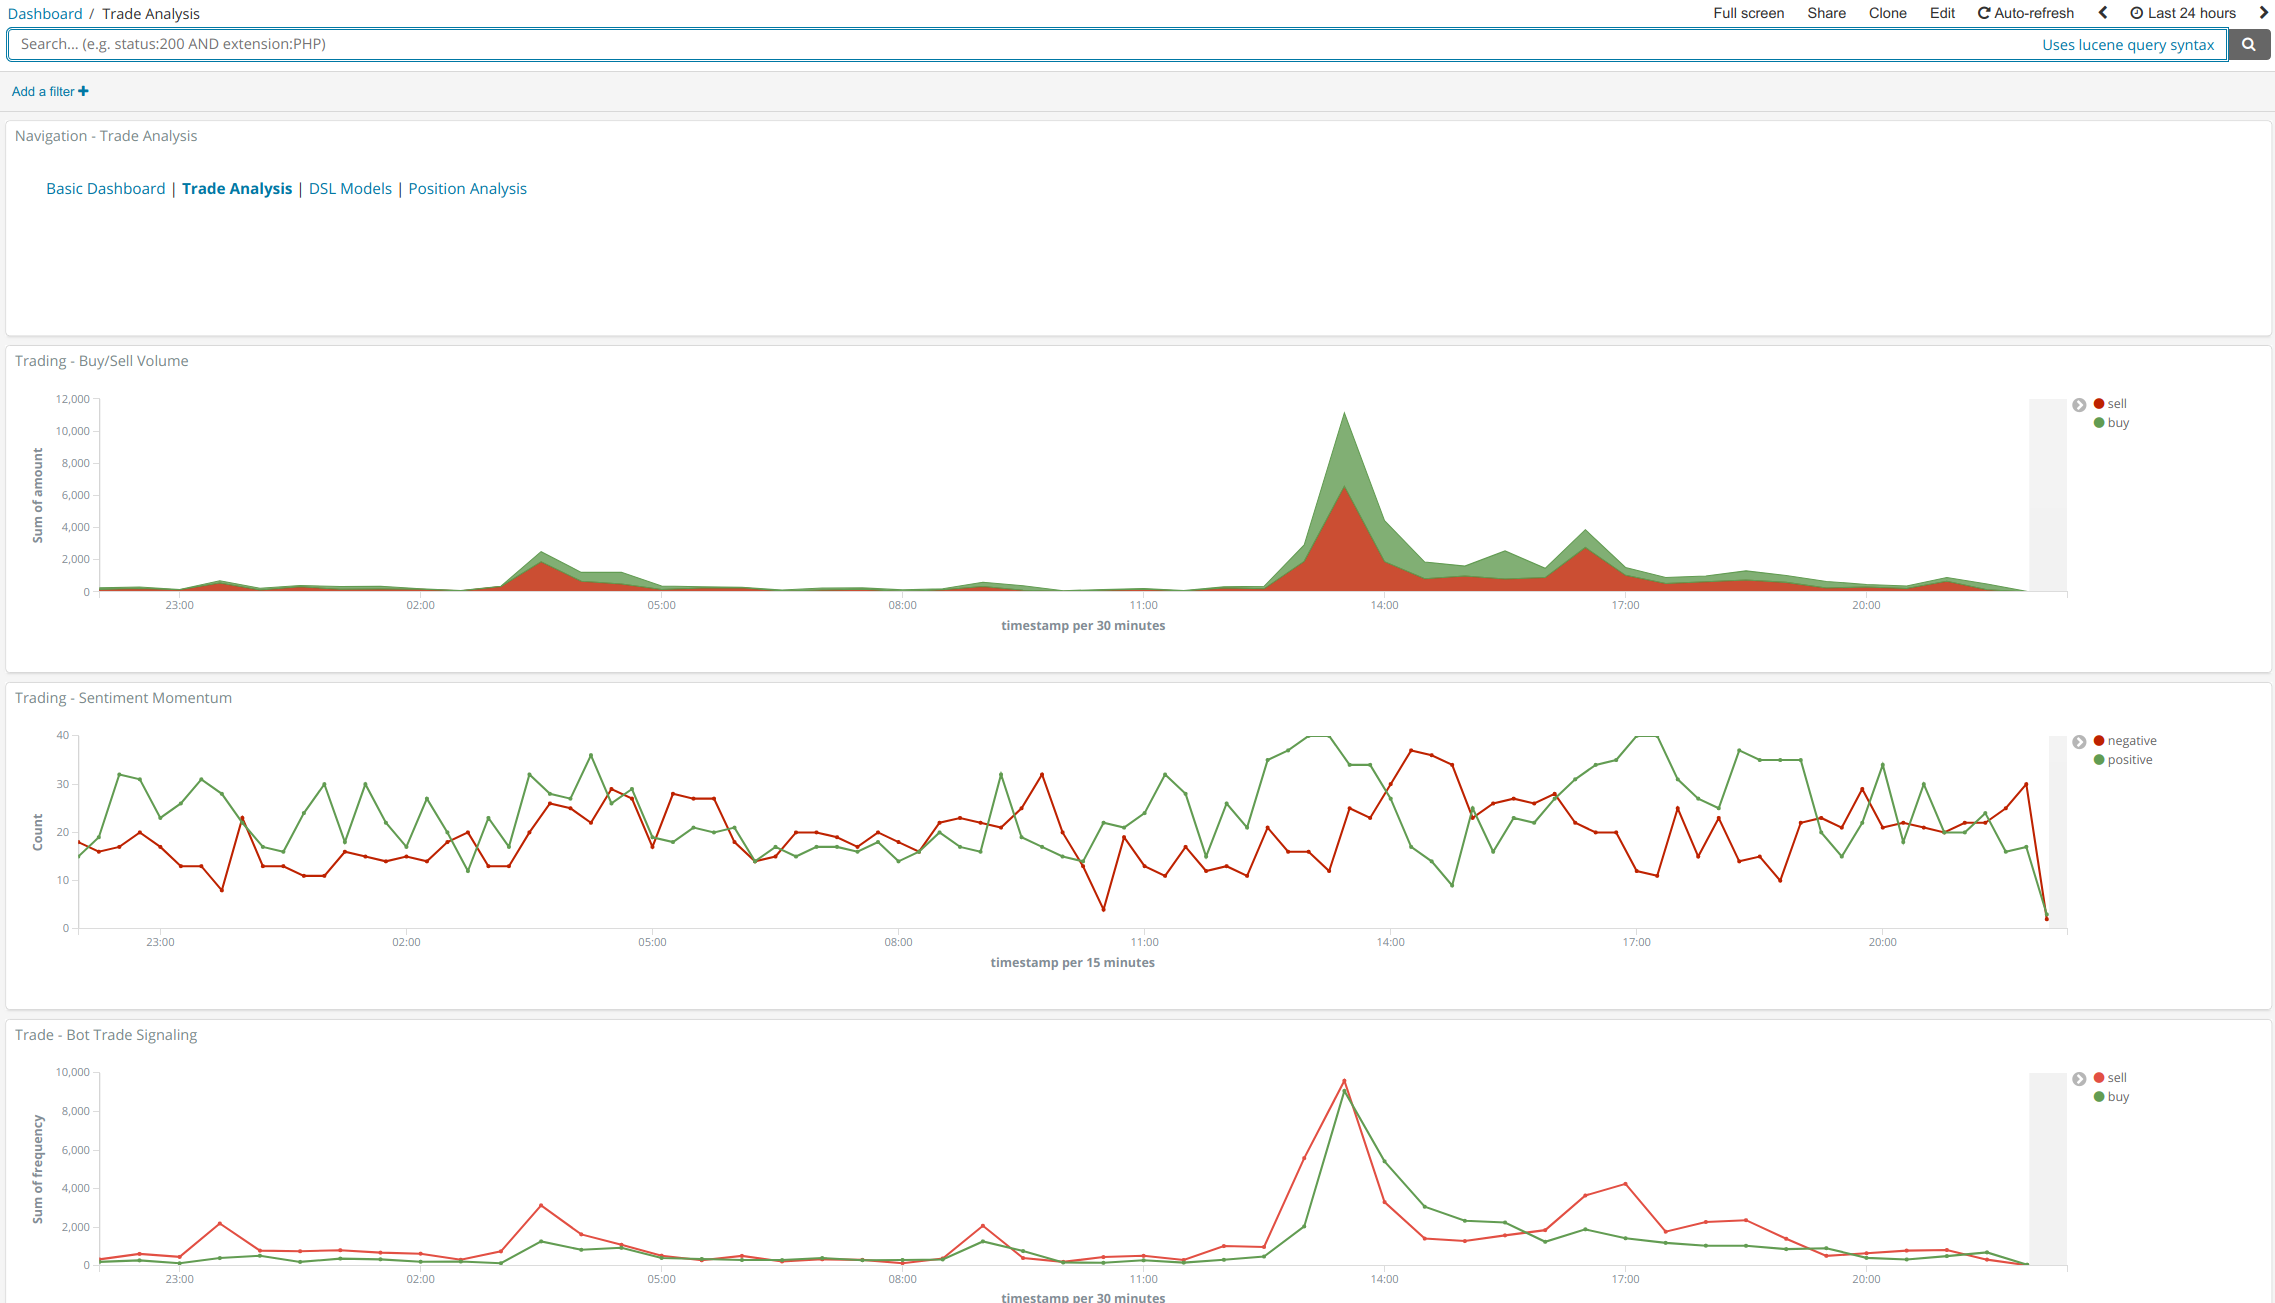
- Trade Analysis Dashboard - A more trade detail oriented dashboard to expose out various metrics within bitcoin's price movements. At the moment, we expose metrics like volume discrepencies, velocity of price increase and publicly available trade frequencies on various timeframes. A simple refactor of our ingest pipeline could allow us to expose more advanced metrics such as RSI divergences as a part of pre processing pipeline. Once we decided on a trading metric to use with our bot, this is where it first gets visualized.
- DSL Model Dashboard - Inspection of visualization to take positions is usually a manual work, requires inituition and takes a lot of practice. Normally, as a day trader when I manually log in to a charting solution to see possibilities of a trade, I follow the following steps:
- Log into preferred charting solution(s) and adjust to appropriate timeframe(s).
- Inspect selected indicators such as RSI/Volume Profiles/Resistances, Support, Previously Drawn trend lines, any hidden divergences and patterns etc on various timeframes.
- If I find any indicator that catches my eyes, I quickly backtrack to see if more indicators confirm that and also if simillar patterns have played out in the past.
- I then Open/Close a position with appropriate size depending based on how confident I am about that indicator and overall price movements with an exit strategy (of course executing exit strategy is quite hard if we account for factors like greed, fear and lack of experience - which is precisely a non factor for automated trading).
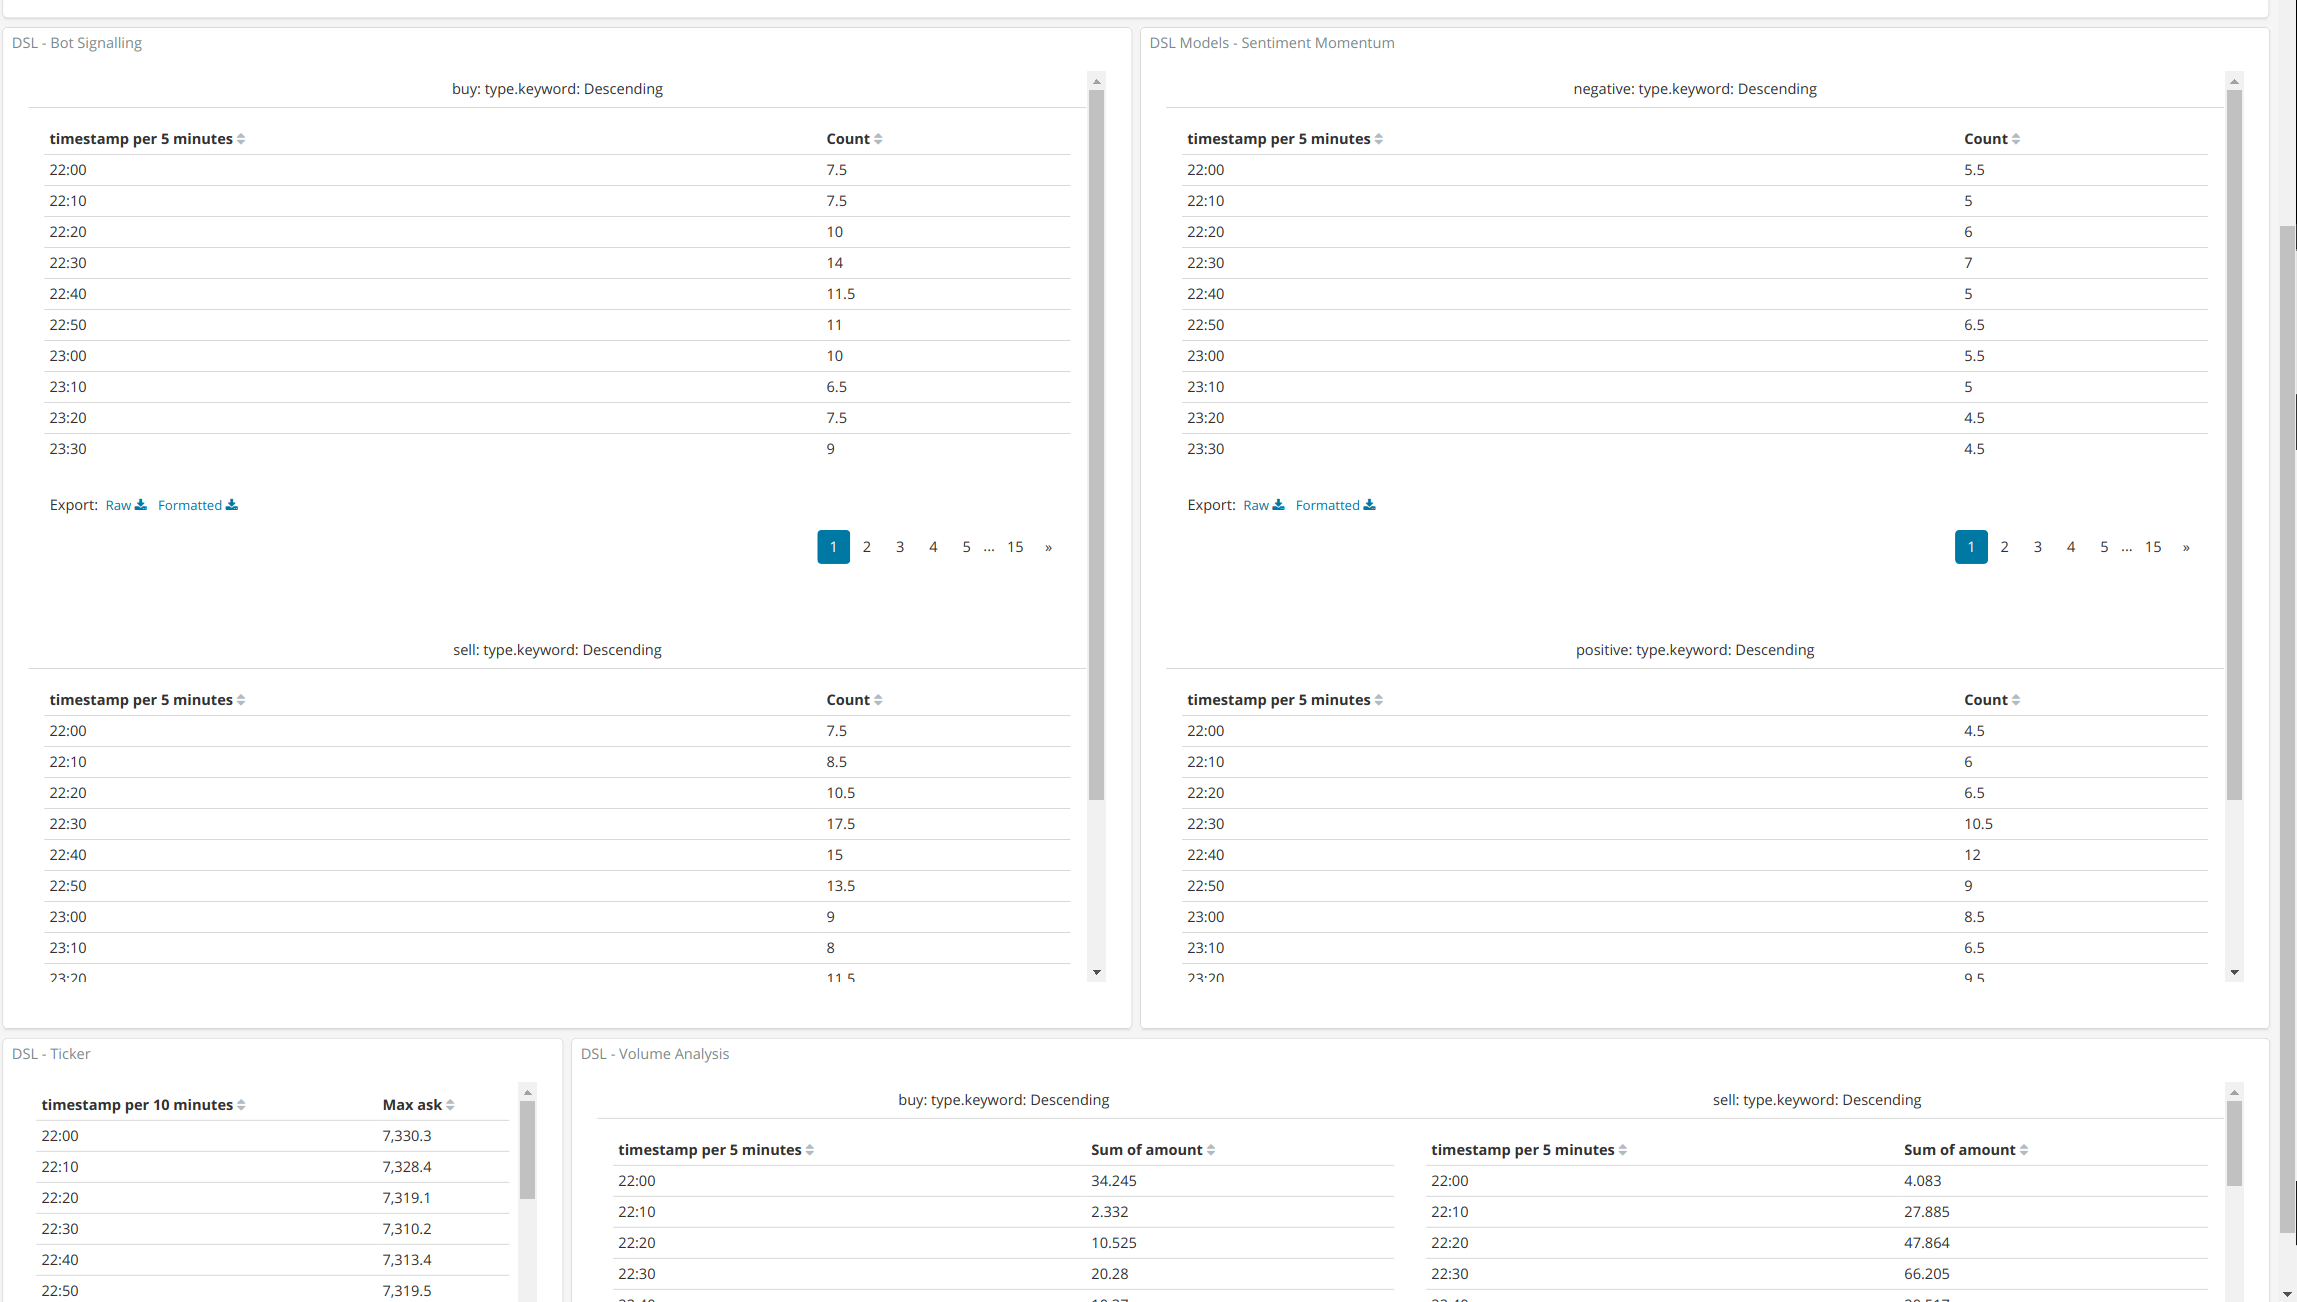
Our DSL model dashboard allows us to loosely automate exactly these steps by creating DSL Models that grabs similar data programatically on various timeframes. While our bot might not have inituitions like us, our bot will have very good memory since it can back test data.
This dashboard is simply a transformation of visuals from
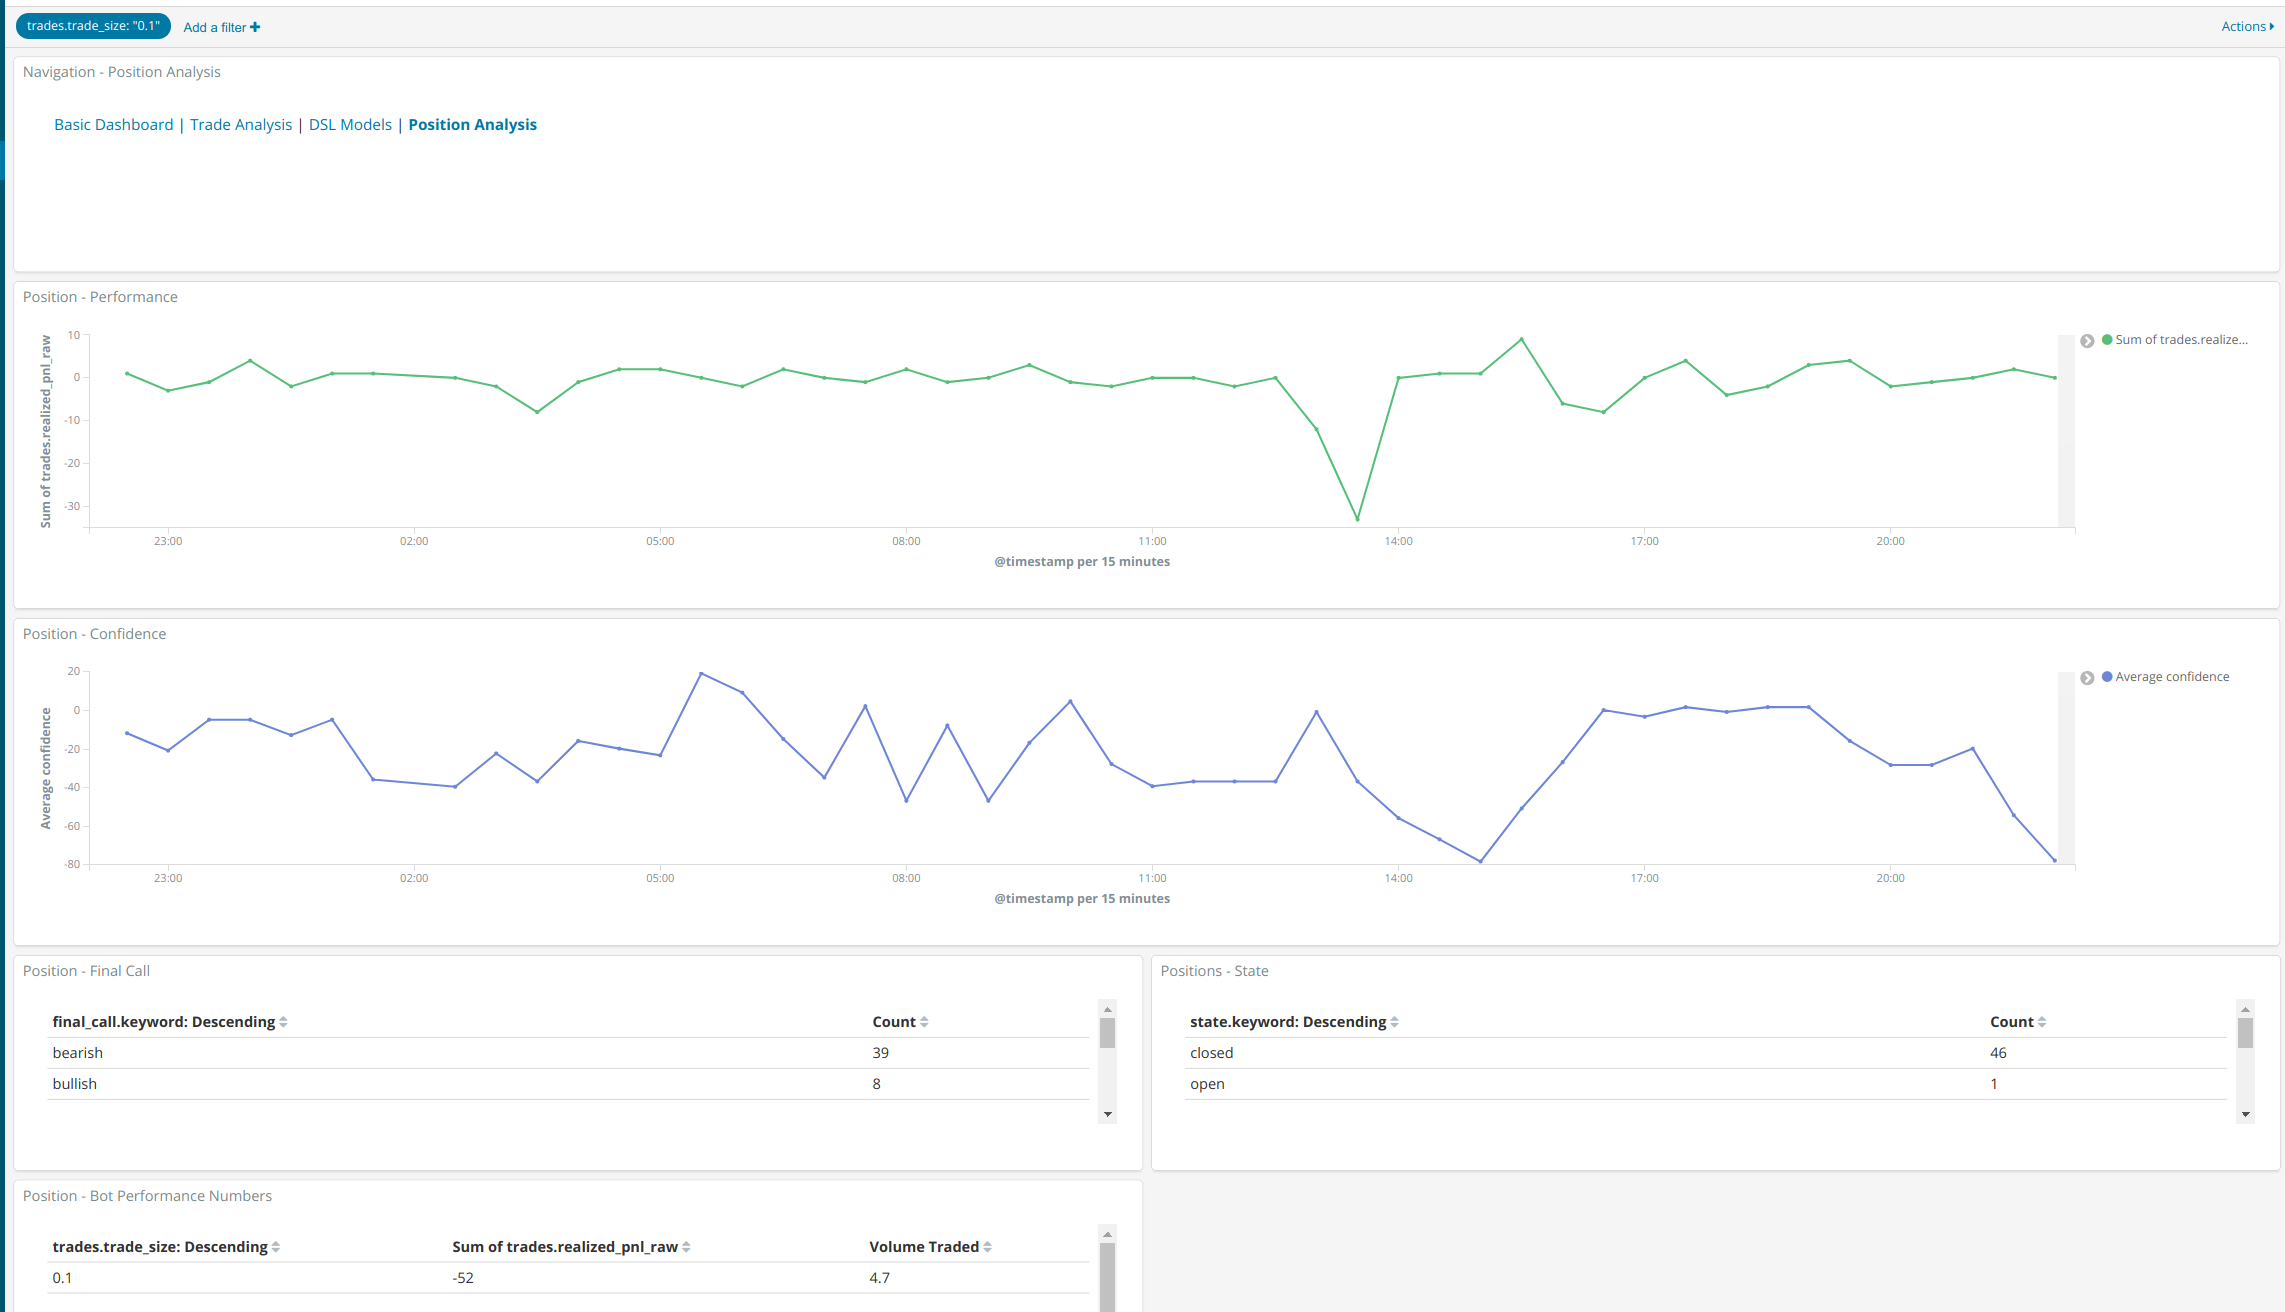
Trade Analysis Dashboardto create queries for taking positions. - Position Analysis Dashboard - Because we have so many parmeters and hyperparameters involved when making a trade decision, we track each and every of our position and store it back to elasticsearch for back testing purposes. This dashboard allows us to filter out our positions (based on trade size, confidence & accuracy of our indicators) and determine the quality of bot in addition to providing feedback to our so we can implement a self learning model for our bot.
We will look into actually using the trading bot and fine tuning our bot's parameters/hyperparameters by briefly going through the bot code in Section II of the article.
Section 2
2A. Brief Overview of Code Implementation
The entire project is controlled by two main crons.
bitfinex.js- An ingest cron to transform publicly available data on bitfinex's websocket before inserting it into elasticsearch. We ingest bitfinex to ingest data but use gdax's order book to trade against. (This is because our default prameters have been set to look into smaller timeframe for sake of momentum trading and gdax usually tends to follow bitfinex's movements when bitcoin's price is ranging - an important thing to consider, while we may be able to accumulate fiat when prices are ranging, more importantly we want to pre-emptively recognize and exit or trade volatility to positively offset out total pnl.)
Not a lot is going on this cron since we are just ingesting data. We do some normalization & pre-processing that will help us get aggregated metadata later. We configure the default to push data to elasticsearch on every ticker update (as opposed to set timeframe which is more lenient on resources - although one would imagine bitfinex also does have some rate limits on it's websocket data!).
We do insert this data into two separate indices prefixed btc-bfx-ticker* (price specific data) & btc-bfx-trade* (trade specific data)
Elasticsearch document sample for ticker data and trade data.
position.js: Position taking cron is where the actual evaluation happens! A high level pesudocode looks as follows:- Make calls to elasticsearch according to configured timeframes. These timeframes can be coded to be influenced by where in wyckoff phase we guess the market is. (We don't bother making timeframes programmatic as they are just logical buckets for us to get data by. Adjusting timeframes to adjust out results have implications of us adjusting our questions to fit our answers instead of the other way around.)
- Once we have all the data we need (which are essentially tables from "DSL Model Dashboard") we transform them using our decorator to create a final evaluation object. Link to code.
- Once we have a "final evaluation" object we close our older trades.
- The older trades here implies positions we have opened on our previous runs.
- We create a new trade document once we have closed older documents and we meet confidence criterias.
- Finally, we can either choose to actually send an email alert on top of taking a position (this could be any series of action instead of just executing market buys and market sells on gdax) if we cross confidence threshold when calculating our position. By default we configure our bot to remain "bearish" to preserve unsual loss of USD. This is explained in more detail in the next section about configuration.
A reference to what our "final evaluation object" looks like:
    {
        "bot_signal": {  // Information about frequency of bot buys in order trade book
            "buy_strength":  0, // Bot buy frequency
            "sell_strength": 0, // Bot sell frequency
            "local_timeframe_buy_wins": 0  //  Positive tends towards more buys, local wins of frequency on each time influence
        },
        "sentiment_momentum": { // Information about consecutive rise in bitcoin prices, we want to trade this data on smaller timeframes if our parameters have been configured towards momentum trading
            "buy_strength":  0, // Volume of buy
            "sell_strength": 0, // Volume of sell
            "buy_strength_momentum": 0, // Trailing difference on wins for calculation of variance in buys & wins to denote effectiveness of buy_strength wins
            "sell_strength_momentum": 0  // Trailing difference on wins for calculation of variance in buys & wins to denote effectiveness of sell_strength wins
        },
        "price_volume_analysis": { // Basic price volume analysis results
            "isLocalVolBuyWin": 0, // Volume traded wins for buy in local time frames
            "isLocalFrequencyBuyWin": 0, // Frequency traded wins in local time frames based on ticker data
            "volume_difference": 0 // Total raw volume difference to indicate overall buys vs sells multiplied by price points
        },
        "indicators": { // Standard indicators calculated using tulind indicators
            "adsoc_indicator": 0, // Accumulation/Distruction Oscillation Indicator
            "RSI": { // Standard RSI related metrics - capabilities for lookup of hidden divergences in prices & rsi haven't been implemented
                "average": 0, // Average rsi of a bucket since we are not calculating rsi during ingestion
                "isStrongOverBoughtSignal": 0, // Configured rsi threshold since over bought and over sold conditions on medium timeframes for rsi are usually reliable signals
                "isStrongOverSoldSignal": 0
            }
        },
        "final_call": 0, // Final call enum, "bearish" || "bullish", ultimately you can only either take a position or not take one.
        "confidence": 0, // +80 or -80 are usually labelled good confidence with default tunings - good enough to send email if you dont want automated bot signals
        "position_sizes": undefined, // Configured position sizes
        "trades": [], // Trade objects
        "opened_at": undefined, // Trade Opened at date object
        "closed_at": undefined, // Trade closed at date object
        "metadata": {} // Extra data, holds traded timeframes and hyperparameters for back test analysis
        };
    };
Link to a well formed final evaluation document.
Example of a trade object:
 {
    "trade_size": trade_size, // Size of trade data, usually there are multiple sizes especially for gathering back testing data purposes
    "trade_time": new Date(), // Time of trade object creation
    "average_entry_price": 0, // Average entry price of trade against gdax order book
    "entry_price": 0, // Total entry price of trade
    "average_exit_price": 0, // Average Exit price of trade against gdax order book
    "exit_price": 0, // Total exit price of trade
    "realized_pnl": 0, // Percentage profit or loss between trade open and trade close duration
    "realized_pnl_raw": 0, // Total raw dollaroos earned/lost
    "fees_percent": fees_percent // Fees needed to offset raw pnl
    }
}
Code level documentation is also provided on positions.js of the project.
2B. Configuring and using this bot for taking positions with appropriate analysis
Configuration of our bot mainly happens during initialization.
parameters.json also contains a property called "hyperparmeters" which is responsible for configuring the bot behaviour for most part.
Another parameter that plays a role in bot's evaluation lies in the "assign_confidences" model.
While the functions exported from data/decorator model are mostly responsible for simple data transformation, we do have an final processor function which is responsible for creating the evaluation object mentioned above using configured confidences.
Confidences
Our confidence can range from -100 (bearish) to +100 (bullish). Our bot most certainly won't be 100% confident, but we configure it to take actions based on thresholds which are configured here(email alerts) and here(trade execution demo).
Notice the assignment of confidences and values in our final processor are hard coded at this point. These parmeters should ideally be stored on a separate fourth index (eg: btc-bfx-indicators) and configured programmatically to pull and assign dynamic confidences on the fly based on backtesting of bot's own performance and historic price data.
2C. Brief Overview of our bot's current/default performance
At the time of writing this post, the default configured confidences assignment & thresholds shows almost ~3% profit on the past 24 hour time frame with 0.1 BTC volume per trade (in the demo mode, the bot will always "trade" no matter what), with positions executed every 30 mins. Important to note that 06/07/2018 was a relatively non volatile day. The default configs more often than not will result in negative pnl. We do use moderately agressive fees margin on our default setup to encourage the cloners to investigate more before actually using the setup to make trades so the actual realized pnl will always be more than what is visualized.
As mentioned earlier, a recommended way to further improve performance of the default configuration would be to overide current decorators and confidence allocators along with timeframe configurations based on backtesting data to best improve the performance. A well learning model should seek to improve data provided by our "Bot performance" dashboard by tuning the suggested fourth "btc-bfx-indicators*" elastic index.
Price volume analysis espcially has a lot of room for extension of indicators like stoic oscillator & dynamic support/resistance lines.
2D. Expansion ideas and some caveats of the Project
- Because we are indexing data on elasticsearch, the project can be a lot more event oriented with appropriate watcher configuration.
- We are lacking dynamic indicator configuration currently. Implementation of this could simply be an extension of decorator and few extra calls during initial asynchronous calls to elasticsearch on
positions.jswhen chain fetching data from configured timeframes. - We haven't implemented a standardized draft for our ingest pipeline. A standardized draft for our prices & trade data index would allow us to ingest data from multiple trading platform like bitmex, gdax etc. An ideal setup would allow us to combine movements from various markets. Example: If there's any FUD news say from Korean markets we could influence the ingest pipeline with OkEx market and have it trade on platforms we consider to be slowest in following the price movements there. This could also potentially be more useful in proactive loss prevention by watching various markets.
Appendix: Screenshots
Main Dashboard:
Trade Analysis:
DSL Models:
Bot Performance:
Conclusion
We were able to create an end to end automated trading bot with relatively less effort thanks to elasticsearch & nodejs! Feel free to leave comments below or open any code related issues.